This project was inspired by the catastrophic flooding that took place in Bosnia and Herzegovina in May 2014. The region had experienced catastrophic rainfalls, resulting in the accumulation of three months of rainfall in just three days. The heavy rainfalls triggered numerous mudslides and river flooding, with river waters flooding up to 10 kilometers in-land. The natural disaster destroyed and damaged over 100,000 structures. Perhaps the biggest consequence of all was the displacement of minefields and signs left over from the conflict during the 1990s.
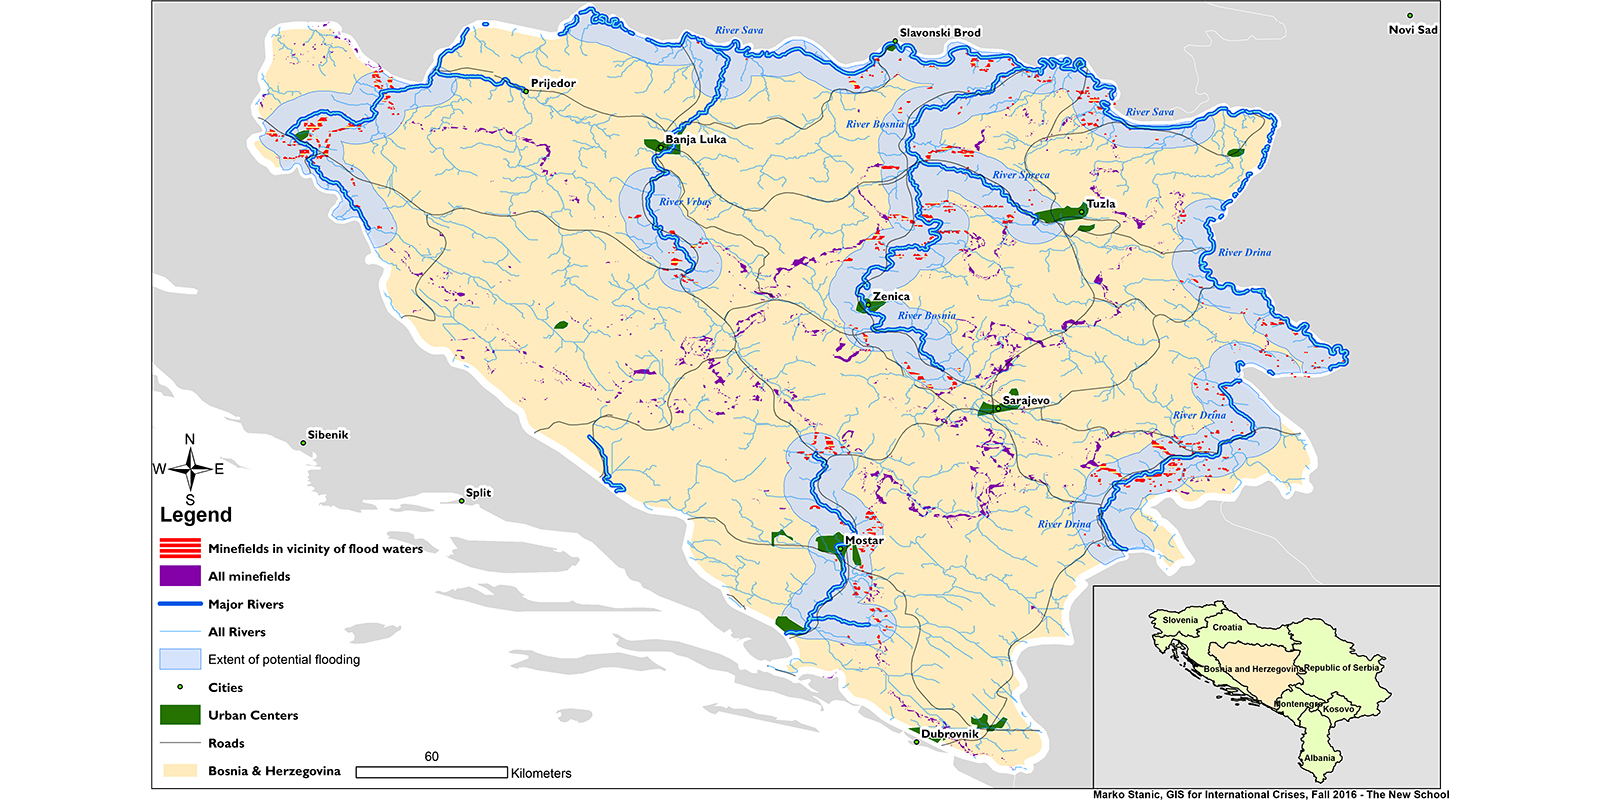
The map aims to illustrate areas known to be contaminated with anti-personnel mines and other unexploded ordenance through out Bosnia and Herzegovina, highlighting those areas that might suffer from floods. The map may be used to prioritize which territory requires priority for mine action and cleanup.
Methodology
The map plots the known “suspicious surfaces” against nearby rivers. Ideally I would have used the raster data create the sourced map, so my next best step was to extract the ‘RED’ areas and convert them into polygons for my use. Prior to this, georefrencing was executed to lineup the projection of the “suspicious surfaces” map to my working map. All minefields are colored purple, while minefields within the potential flood radius are marked with red stripes and a yellow highlight on the map. The potential for flood waters was created by running the Buffer toolset in ArcGIS, where 8 kilometer radius was used. I determined 8km to be appropriate buffer/flood potential based on the fact that when river Sava flooded in May 2014, the waters reached as far as 8km in-land. I used the following satelite image courtesy of NASA Earth Observatory to measure the extent of the flooding using the measure tool in ArcMap.
Rivers were entirely created using the Hydrology Toolset in ArcMap. Fill, Flow Accumulation, Flow Direction, Stream Order were executed (in that precise order). Upon finishing Stream Order, six ‘Unique Values’ (under symbology) were assigned to all the rivers and streams. For the scale of this map, I decided to eliminate the 3 smallest river and stream types, and plot the flooding of the remaining 3 largest river and stream networks. The map then illustrates all of the flowing water, while showing the flood potential of major rivers only. These rivers include Sava, Bosna, Drina, Vrbas, and Spreca.
I separated river ‘sizes’ 1,2,3 from 4,5,6 by using ‘Select by Attributes’ function in the Stream Order raster to select polygons(rivers) that had the GRIDCODE of 4 or greater – these were my major bodies of water. The data was exported, and the new file contained only the major rivers (4,5,6). The next step was to execute ‘Select by Location’ once again, using the river buffer (8km buffer) as the input. With the buffer of major rivers selected, I ran ‘Clip’ to isolate the minefields within the buffered areas, using 1 kilometer as the XY tolerance, so that the buffer/flood waters were captured within 1km of the minefields already inside the flood zone. (A bit hard to explain, but basically I eliminated the flood potential from the areas that did not have minefields – if you look at the southeastern part of the country, a major river is indicated, but flood radius is not established due to the lack of suspicious surfaces).
Data
I sourced the following materials for this project:
- Suspicious Surfaces Map created by BiH Mine Action Center, June 2016
- Satelite Images of Flooding, captured by NASA's MODIS Satelite, Earth Observatory, May 2013
- Natural Earth Data, Cultural Vector Data for the country boundries
Other Materials
I worked on this project as part of my graduate study at The New School, and as such I had the pleasure of presenting my work and results to my classmates. You can find my presentation materials here if you're further interested in this work.